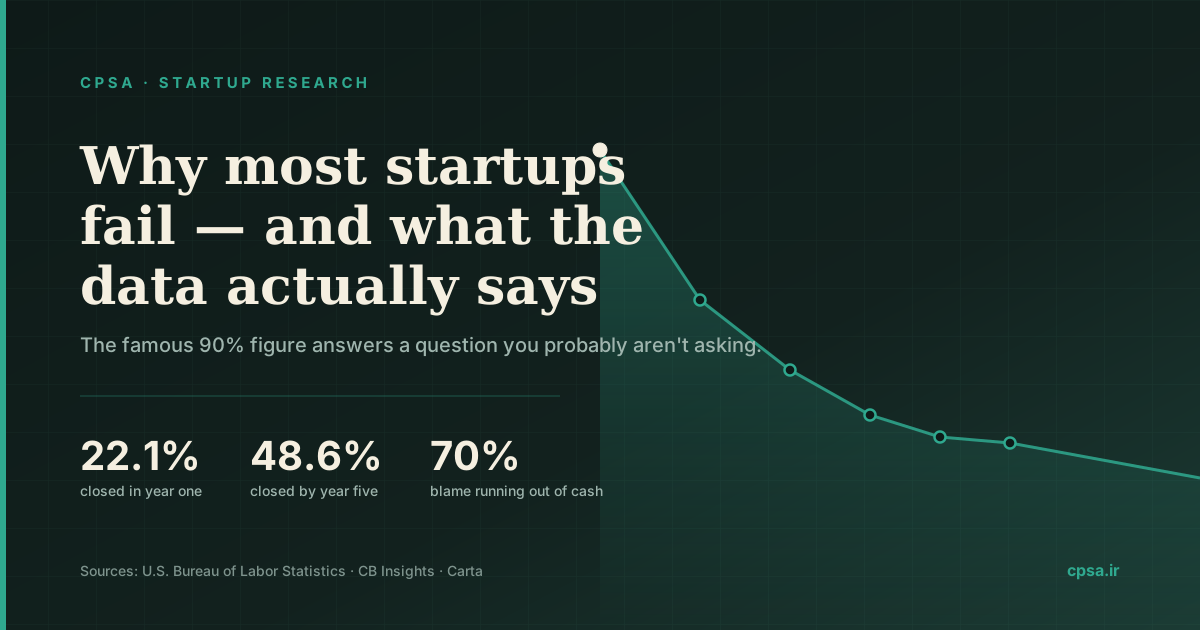
Almost every article about startup failure opens with the same sentence: 90% of startups fail. It is one of the most repeated numbers in business, and it answers a question that most founders are not actually asking. Federal data on real businesses puts one-year closure at 22.1% and five-year closure at 48.6%. The 90% figure comes from a different population, judged against a different standard — venture-scale returns rather than survival. Confusing the two is not a rounding error. It changes which risks you manage and which decisions you make.
Two different questions, one badly shared number
Ask will this business still be open in five years? and you are asking a survival question. Ask will this company return ten times its investors' capital? and you are asking a portfolio question. The startup literature has spent a decade answering the second and letting founders apply the answer to the first.
The U.S. Bureau of Labor Statistics tracks every new private-sector establishment, from dental practices to SaaS companies. Its Business Employment Dynamics survival tables put one-year closure at 22.1% and five-year closure at 48.6% for recent cohorts. Separately, Harvard Business School research by Shikhar Ghosh found that roughly 75% of venture-backed companies never return cash to investors, and Startup Genome has estimated that around 90% of scalable, innovative startups fail to reach venture-scale returns. All three numbers are defensible. None of them are interchangeable.
| The survival question | The venture-return question | |
|---|---|---|
| Population | All new private-sector establishments | Venture-backed, high-growth companies |
| Definition of failure | The business stops operating | Capital is not returned at a multiple |
| One year | 22.1% closed | Not measured this way |
| Five years | 48.6% closed | Not measured this way |
| Headline figure | 65.3% closed by year ten | ~75% never return capital; ~90% miss venture-scale returns |
| Primary source | BLS Business Employment Dynamics | Harvard Business School; Startup Genome |
What the survival curve actually looks like
A single percentage hides the most useful information in this data. Plot survival year by year and the shape itself becomes the finding.
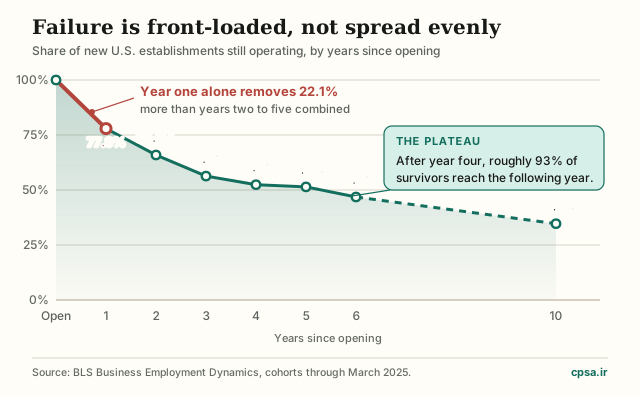
| Tenure | Cohort year ended | Still operating | Closed |
|---|---|---|---|
| 1 year | March 2024 | 77.9% | 22.1% |
| 2 years | March 2023 | 65.9% | 34.1% |
| 3 years | March 2022 | 56.3% | 43.7% |
| 4 years | March 2021 | 52.4% | 47.6% |
| 5 years | March 2020 | 51.4% | 48.6% |
| 6 years | March 2019 | 46.8% | 53.2% |
| 10 years | March 2015 | 34.7% | 65.3% |
Front-loaded risk is actually good news
If risk were spread evenly across a company's life, the odds of dying in year eight would resemble the odds in year one, and permanent caution would be the rational strategy. That is not the shape of the data. The hazard concentrates almost entirely at the beginning, which makes the strategic objective of a young company unusually narrow: reach the plateau.
The job of year one is not to win. It is to still be here in year four, holding evidence a competitor does not have.
That reframes what early spending is for. Money spent in year one that buys durable evidence — that a specific customer pays a specific price, repeatedly — moves you toward the plateau. Money spent scaling before that evidence exists simply moves you along the failure chain faster.
What actually kills startups in 2026
The ranking most articles still quote — 42% no market need, 29% ran out of cash, 23% not the right team — comes from an analysis of 101 startup post-mortems published more than a decade ago, shaped by an era of cheap capital. In March 2026, CB Insights rebuilt that analysis on 431 venture-backed companies that shut down from 2023 onward, classifying causes for 385 of them. The order changed.
- Ran out of capital70%
- Poor product-market fit43%
- Bad timing or macro conditions29%
- Unsustainable unit economics19%
Companies cited multiple causes, so these shares total about 161% and cannot be added. Base: 385 of 431 tracked shutdowns with classifiable causes. Source: CB Insights, March 2026.
| Rank | 2014 analysis — 101 post-mortems | 2026 analysis — 385 classified shutdowns |
|---|---|---|
| 1 | No market need — 42% | Ran out of capital — 70% |
| 2 | Ran out of cash — 29% | Poor product-market fit — 43% |
| 3 | Not the right team — 23% | Bad timing or macro — 29% |
| 4 | Outcompeted — 19% | Unsustainable unit economics — 19% |
Cash is the mechanism, not the cause
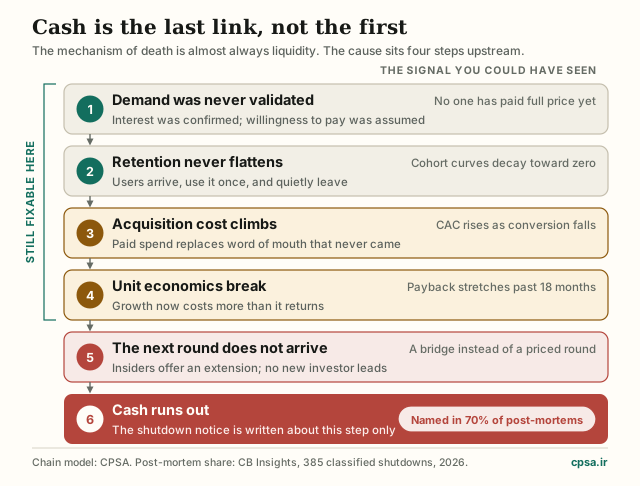
Seventy percent of post-mortems name capital exhaustion, and in a narrow sense each one is accurate: the company stopped because the money stopped. But ran out of cash carries the same explanatory weight as the patient stopped breathing. It describes the moment, not the disease.
In nearly every case the money ran out because something upstream had already broken. The sequence repeats consistently enough to be treated as a chain, and the useful property of a chain is that it can be interrupted at any link you can still see.
The runway gap: a failure mode made of arithmetic
Some failures are strategic. This one is arithmetic, and it is recent enough that most planning templates have not caught up with it.
The standard advice is to raise 18 months of runway. That convention was set when the median wait between a seed round and a Series A was about 18 months. It no longer is. On Carta, the median gap between primary funding rounds stretched to 774 days — roughly 25 months — by late 2024. Over the same period the odds of clearing the bar fell sharply: about 30.6% of the 2018 seed cohort reached a Series A within roughly 24 months, against about 15% of the 2023 cohort.
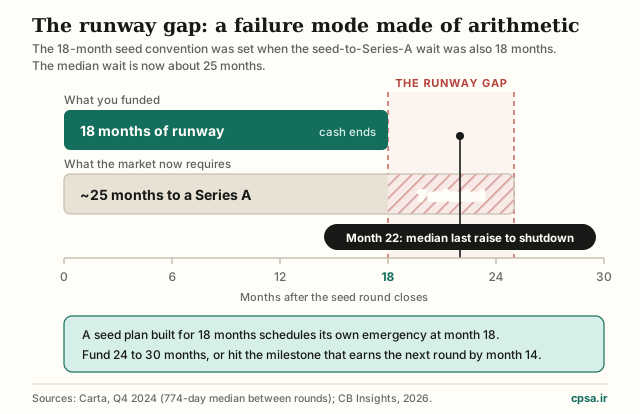
Put those two numbers side by side and a gap appears that nobody budgeted for. An 18-month plan against a 25-month median means the fundraise begins from a position of weakness, about seven months short, at precisely the moment leverage matters most. It is no coincidence that close to 40% of seed-stage financings are now insider bridges and extensions rather than priced rounds.
| Monthly net burn | Runway from $3.0M | Against a ~25-month gap |
|---|---|---|
| $75,000 | 40 months | Comfortable |
| $125,000 | 24 months | Adequate with discipline |
| $175,000 | 17 months | Short by about 8 months |
| $250,000 | 12 months | Short by about 13 months |
The 22-month clock and the walking dead
CB Insights found the median time from last fundraise to shutdown is 22 months — inside the very gap described above. More than half the companies in that dataset died within two years of their last raise. Nearly a quarter had been going for more than three years since their last round before formally closing.
That long tail has a working name: the walking dead. Close to 50,000 venture-backed startups have not raised since the start of 2023. Not all are failing — some are profitable and simply do not need capital — but the cohort is large enough that still operating has stopped being a useful signal of health on its own.
The dashboard that sees failure before the bank account does
If cash is the last link, a cash-flow forecast is the last warning you will get. The metrics worth watching are the ones that move first. The thresholds below are working defaults for an early-stage software business; adapt the numbers to your model, but keep the discipline of naming a critical line before you need it.
| Signal | Healthy | Watch | Critical |
|---|---|---|---|
| Runway | 24+ months | 12–18 months | Under 9 months, no term sheet |
| Net revenue retention | Above 100% | 85–100% | Below 80% |
| Cohort retention curve | Flattens and holds | Flattens then slowly decays | Decays toward zero |
| LTV to CAC | 3:1 or better | 2:1 to 3:1 | Below 1.5:1 |
| CAC payback | Under 12 months | 12–18 months | Over 24 months |
| Gross margin trend | Stable or improving | Slipping 1–2 points a quarter | Falling as you scale |
| Referral share of pipeline | Growing share | Flat share | Falling while paid spend rises |
| Team | Voluntary attrition under 10% | Key role open over a quarter | A founder or key lead has disengaged |
Each row is a leading indicator for one link in the chain. Reviewed monthly against written thresholds, they convert a slow decline into a decision. For the mechanics, see financial metrics every startup should track and lifetime value calculation.
Write your kill criteria before you need them
Dashboards do not fail because of measurement. They fail because of sunk cost. By the time the numbers are clearly bad, the founder has years invested and a team depending on the answer, and every ambiguous datapoint reads as hope. The only reliable defence is to decide in advance, in writing, while judgement is still cheap.
Name the falsifiable belief.
Write the one assumption the business depends on as a sentence that could be proven wrong. Clinics will pay $400 a month to cut no-shows is falsifiable. Healthcare needs better software is not.
Set the evidence bar and the date.
Define what result counts as confirmation, and by when. Be specific enough that a stranger could check your work without asking you a question.
Write the kill criteria.
State what you will do if the bar is missed: pivot, shrink to profitability, or stop. Name the decision, the date, and who makes the call.
Give someone else the trigger.
A co-founder, board member, or advisor holds you to the date. Founders reliably renegotiate deadlines with themselves.
Run a pre-mortem every quarter.
Assume it is eighteen months from now and the company has died. Write the reason. If the reason you write is already visible in this quarter's numbers, you have found your priority.
What changes in a capital-constrained ecosystem
Every figure above comes from a market with deep venture capital, and most of the world does not operate in one. For founders in Iran and comparable ecosystems — where cross-border payments are hard, follow-on rounds are scarce, and there is no dependable Series A to graduate into — the venture-return framing is close to irrelevant. Applying it anyway is actively harmful, because it rewards burn that no future round will refinance.
The survival framing is the useful one here, and the plateau is reached through profitability rather than through a next round. In practice that inverts several standard playbooks.
In Iran that inversion is concrete. A team that prices in rial, collects with a delay, and cannot easily hold dollars has a cash-conversion cycle that US runway tables do not describe. Sanctions and payment-rail friction also mean a “bridge round” is often not available at any price. The useful dashboard is therefore local: days of cash after receivables, gross margin after payment fees, and the number of customers who have paid twice. Those three numbers tell you whether the plateau is forming. Carta’s 1.9-year seed-to-A median is a warning about US calendars, not a fundraising plan for Mashhad.
This is the lens CPSA applies with the teams it works with in Mashhad and across the region: fix the earliest broken link, price for margin, and treat reaching the plateau as the strategy rather than a consolation prize.
Frequently asked questions
Is it true that 90% of startups fail?
Not as a general claim. Among all new U.S. private-sector establishments, about 22.1% close within one year, 48.6% within five years and 65.3% within ten. The 90% figure describes venture-backed, high-growth startups measured against venture-scale returns rather than survival. It takes roughly three decades for a general business cohort to fall that far.
What is the single most common cause of startup failure?
Capital exhaustion is the most frequently cited, appearing in 70% of venture-backed post-mortems since 2023, but it is the mechanism rather than the cause. The most common root cause is weak product-market fit, cited in 43% of the same post-mortems and usually visible much earlier as retention that never flattens.
Which year is the most dangerous?
The first, by a wide margin. Year one removes about a fifth of a cohort, while conditional survival stays above 93% per year after year four. Early survival is disproportionately valuable, which is why the objective of the first two years should be evidence rather than scale.
How much runway should a startup raise in 2026?
Plan for 24 to 30 months rather than 18. The median gap between primary funding rounds stretched to about 774 days, so an 18-month plan means starting the next raise with no cash and no leverage. If you cannot fund 24 months, set the milestone that earns the next round by month 14 instead.
Why do the cited failure percentages add up to more than 100%?
Because companies cite multiple causes. In the 2026 CB Insights analysis the named causes total about 161% of the 385 classified companies, so they describe overlapping factors and must not be summed or read as shares of a whole.
Can startup failure be predicted before the money runs out?
Often, yes. Health scores declined in the year before shutdown for 72% of tracked companies that died, by about 15% on average. Retention curves, CAC payback and the referral share of your pipeline typically move well before the bank balance does.
Do these statistics apply outside the United States?
The pattern — heavy early risk, then a plateau — is broadly consistent across markets, but the specific rates, and especially the venture figures, are U.S.-based and reflect a deep capital market. In ecosystems without dependable follow-on funding, treat profitability rather than the next round as the path to the plateau.
Does failing a startup end a founder's career?
The evidence says no. Repeat founders are common and are often better calibrated on risk the second time. What matters is how the ending is handled: a documented post-mortem, capital returned where possible, and relationships preserved are all assets in the next attempt.
How we sourced this
Every statistic above comes from a primary or clearly attributed source, with its population and date stated. Two cautions are worth repeating. Survival figures cover all private-sector establishments, so they include many businesses unlike a technology startup. Post-mortem cause shares are self-reported and drawn from public shutdowns, so they underrepresent quiet failures.
- U.S. Bureau of Labor Statistics — Business Employment DynamicsEstablishment survival by tenure; cohorts observed through March 2025
- CB Insights — The top reasons startups fail431 venture-backed shutdowns since 2023; causes classified for 385; published March 2026
- Carta — time between funding roundsMedian 774 days between primary rounds, Q4 2024
- PitchBook-NVCA Venture MonitorMedian seed deal value $3.0M and median Series A pre-money $62.0M, Q1 2026
- Crunchbase News — seed to Series A graduationFalling graduation rates for the 2023 and 2024 seed cohorts
- Shikhar Ghosh, Harvard Business SchoolStudy of roughly 2,000 venture-backed companies; about 75% do not return investor capital
- Startup GenomeEstimate that about 90% of scalable startups do not reach venture-scale returns
Last reviewed August 2026. Figures are restated when sources publish revisions. If you spot an error, tell us and we will correct it.
The bottom line
Startups do not fail at one rate and they do not fail for one reason. They fail along a chain, and the chain is usually visible for months before the final link breaks.
The practical conclusion is unglamorous. Ask the survival question rather than the venture-return question unless you are genuinely playing that game. Treat the first two years as the period where risk is concentrated, and spend accordingly. Instrument the upstream signals so cash is never your first warning. Fund the real gap between rounds, or set the milestone that closes it. And write your kill criteria while you can still think clearly, because the version of you who needs them will not be able to.
If you are working through this for a specific company, start at the earliest link you can measure — demand — and move down from there. Where to begin when you have an idea covers the first step, and how to assess feasibility of your idea covers the second.