Unit economics is the story of one customer cohort: what you paid to win them, what they pay you after cost of delivery, and how long they stay. OpenView and other SaaS operators still treat about 3:1 LTV:CAC as a working threshold, not a law. This page does the arithmetic in the open, then shows where a blended average hides a dying cohort.
Write the four inputs
Price the customer actually pays. Gross margin after hosting, payment fees, and delivery labor. Logo churn or, better, revenue churn for that cohort. Fully loaded CAC: ads, commissions, and a honest slice of founder time. Hide any one of those and the ratio is theatre.
Keep the units aligned: monthly churn belongs with monthly contribution, and annual contracts need their collection timing separated from recognized revenue. Mixing annual price with monthly churn can make an invalid LTV look precise.
Worked SaaS cohort
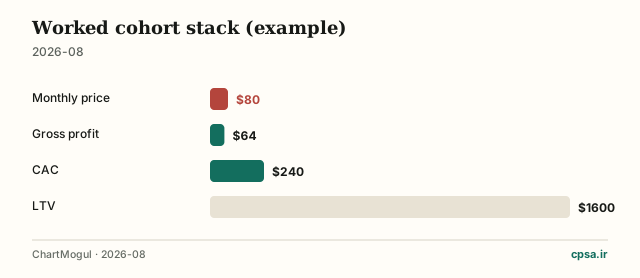
Price $80 per month, gross margin 80%, monthly logo churn 4%. Contribution is $64. Expected months are 1 / 0.04 = 25. LTV is 64 * 25 = $1,600. CAC is $240. LTV:CAC is 6.7. Payback is 240 / 64 = 3.75 months. ChartMogul’s public metrics glossary is the formula source; the numbers are a labeled example, not a benchmark you should copy.
Now hold price and margin constant but let monthly churn rise to 8%. Expected life falls to 12.5 months and the same formula yields $800 LTV, a 3.3 LTV:CAC ratio. The second case crosses from comfortable to merely threshold-level without any change in acquisition spend.
- Monthly price80 $
- Gross profit64 $
- CAC240 $
- LTV1,600 $
ChartMogul (2026-08). Worked cohort, not a census. Assumptions in the body.
When 3:1 lies
A blended 5:1 can hide a new cohort at 1.2:1 if old customers are still in the average. OpenView’s 3:1 floor is a working threshold for healthy software businesses with low expansion. It fails if payback sits past your cash, if churn is seasonal, or if CAC was measured before a channel died.
The ratio also hides distribution: one large expanding account can subsidize many small losses. Inspect retention and contribution by acquisition month and segment before treating the portfolio average as permission to hire.
Marketplace and services variants
A marketplace has two CACs and one take rate. A services firm has utilization, not churn. Do not force the SaaS identity. Write the unit: a ride, a project, a store, a clinic.
For a marketplace, a cheap buyer CAC is meaningless if supplier incentives exceed the take-rate contribution. For services, a profitable project can still be a bad unit when idle staff between projects consumes the margin; include utilization in the denominator.
Iran: fees, delay, and currency
If payment fees and delayed rial collections eat 15 points of margin, the $64 contribution is already wrong. Recalculate LTV after fees and after the actual cash delay. A pretty 6.7 ratio on accrued revenue can be a 2:1 ratio on cash. BLS Business Employment Dynamics is US year-one backdrop, not an Iranian unit-economics rate. ProfitWell / Paddle research treats retention and expansion as LTV drivers, not a floor to import.
Do not translate a dollar benchmark into rial and call it local economics. Rebuild price, delivery cost, collection loss, and replacement wages in the currency in which each cash flow occurs, then stress the exchange rate separately.
Frequently asked questions
Should I include founder time in CAC?
Yes, at a replacement wage, or you will hire into a channel that only works because you are the salesperson.
Gross margin or revenue in LTV?
Contribution after delivery cost. Revenue LTV inflates the ratio.
Is 3:1 required?
It is a common software threshold, not a law. Cash payback is the constraint that can fire you.
How often do I recompute?
Every new cohort month. A quarterly blend is how zombies hide.
Answers to the questions this topic usually leaves hanging.
How we sourced this
Every statistic in Unit Economics Is a Cohort, Not a Slide Average is attributed. Where a number is an estimate rather than a census, the note says so.
- OpenView SaaS metricsWorking LTV:CAC threshold discussion.
- ChartMogul SaaS metrics glossaryLTV, CAC, and payback identities.
- ProfitWell / Paddle researchRetention and expansion as LTV drivers.
- BLS Business Employment DynamicsSurvival backdrop: untested unit economics die in year one.
Primary sources used for this edition.
The bottom line
Put the four inputs on one page with the cohort month. If a number moves, the page moves the same week.
If you want the adjacent decisions after Unit Economics Is a Cohort, Not a Slide Average, start with CAC optimization, LTV calculation, Cash-flow forecast, Why startups fail.